🥽 Analyzing Traces#
The Composer Profiler relies on PyTorch profiler for model operator profiling and adds additional profiling information for trainer loop events, dataloaders, and system utilization metrics. This document highlights additions by the Composer Profiler for augmenting the PyTorch profiling trace with trainer loop events and ways to analyze the collected traces.
The profiler records various duration events such as forward (the time for which forward pass of the model ran; event/forward in the images below) and dumps the information in a file using the Chrome Trace format. At the end of the profiling run, the trace file (containing a trace of events dumped by Composer profiler) is merged with PyTorch profiler trace for a unified view of the full profiling trace of the model. For more information on capturing a
trace file, please see the Performance Profiling tutorial.
Trainer Events#
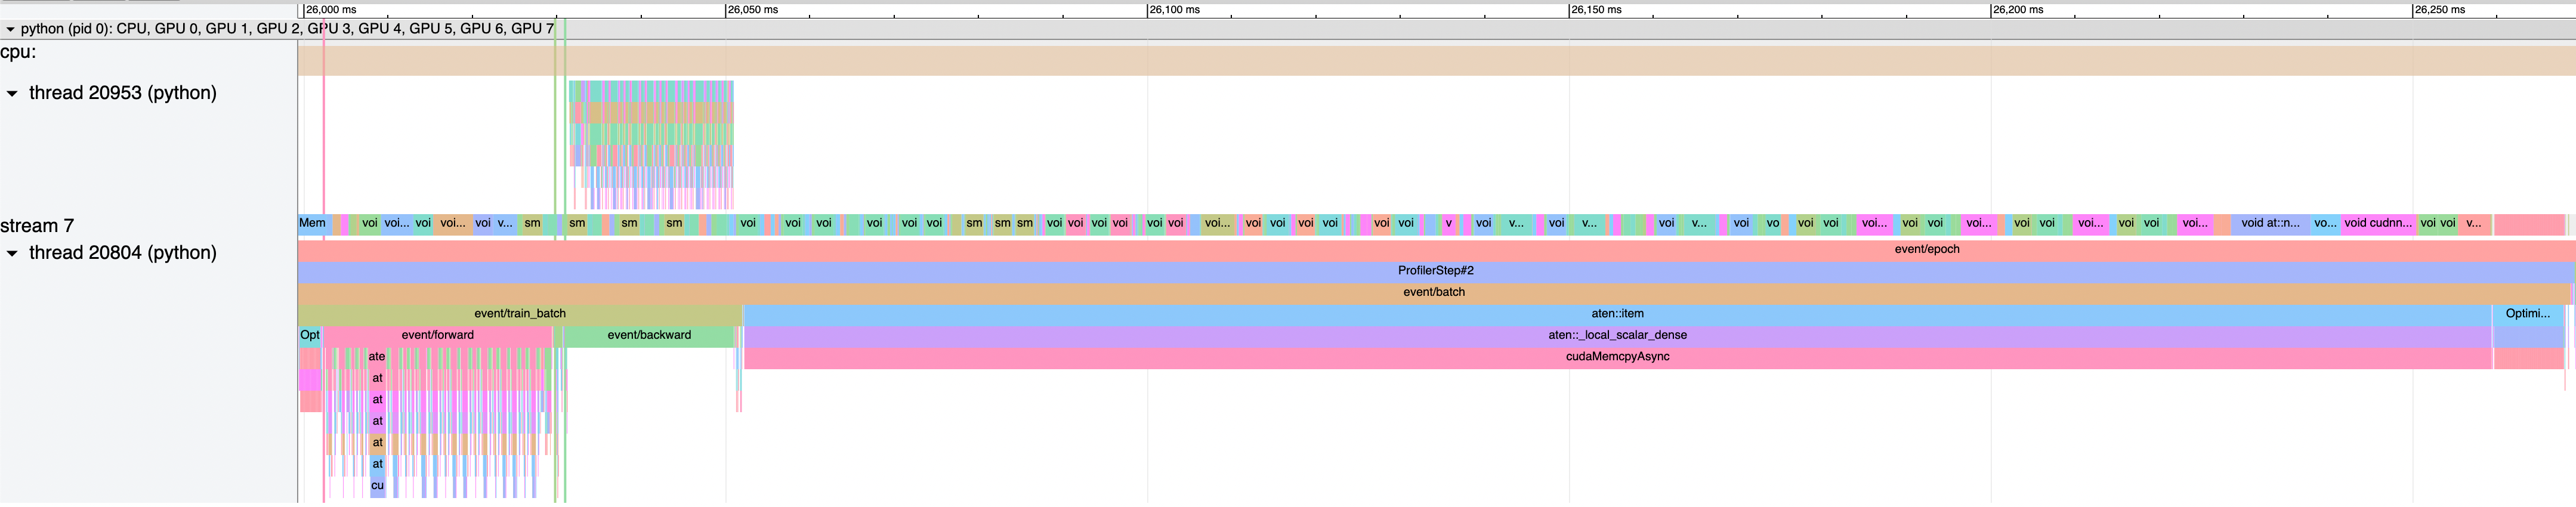
Details about various events of the trainer loop such as the forward pass, backward pass etc. are added to the profiling trace. The various trainer events profiled are listed here. As seen in the image below, the boundaries of trainer loop events such as batch, forward, backward etc. are clearly shown with event/batch, event/forward, event/backward respectively.
DataLoader#
DataLoader profiling measures the time it takes the dataloader to return a batch.
The image below shows the time taken by train dataloader (dataloader/train event) in loading batch 2 of epoch 0.

System Metrics#
System profiling is used to record system utilization metrics such as CPU, memory, disks, network, and network utilization at specified intervals (configured via stats_thread_interval_seconds). System metrics are polled at the specified interval and recorded using the psutil Python module. System profiling can be customized using various hyperparameters. For details, please see the SystemProfiler API reference.
The following image shows recorded cpu and memory utilization (e.g., cpu and memory/cuda/active_mem rows in the picture below) metrics when visualized with the Chrome Trace viewer.

Composer vs Torch Profilers#
The following two pictures show the trace produced by PyTorch profiler only (top) and by the Composer profiler (bottom) for the same model at the same step. As seen in the bottom picture, the boundaries of trainer loop events such as forward, backward, epoch etc. are clearly marked with event/forward, event/backward, event/epoch, respectively, and seamlessly merged with the trace from the PyTorch profiler.

Visualization of trace dumped by PyTorch profiler.

Visualization of the trace dumped by the Composer Profiler. Composer automatically merges the PyTorch profiler operator trace with the training loop profiler trace into an easy to digest trace showing various training event boundaries clearly.
Example: Identifying dataloader bottlenecks#
The image below shows the trace collected with num_workers=0 (i.e., only a single process is used by the train dataloader to load a batch of data). Just by looking at this trace, one can tell that dataloader/train is taking much more time than event/batch (this event contains the forward and backward pass). Therefore, one can conclude that training is dataloader bottlenecked and that increasing the number of workers used for loading data will be helpful.

The same model and dataset as above, but with num_workers=8. We see that dataloder/train is much smaller (almost invisible in the image below) in comparison to the time in event/forward.
